A Global Deal for Our Pandemic Age
Report of the G20 High Level Independent Panel on Financing the Global Commons for Pandemic Preparedness and Response
Report of the G20 High Level Independent Panel on Financing the Global Commons for Pandemic Preparedness and Response
Increasing Frequency of Wildlife Zoonotic and Influenza Spillover Events
The Panel studied data from Metabiota on historical trends in wildlife zoonotic and influenza spillover events.
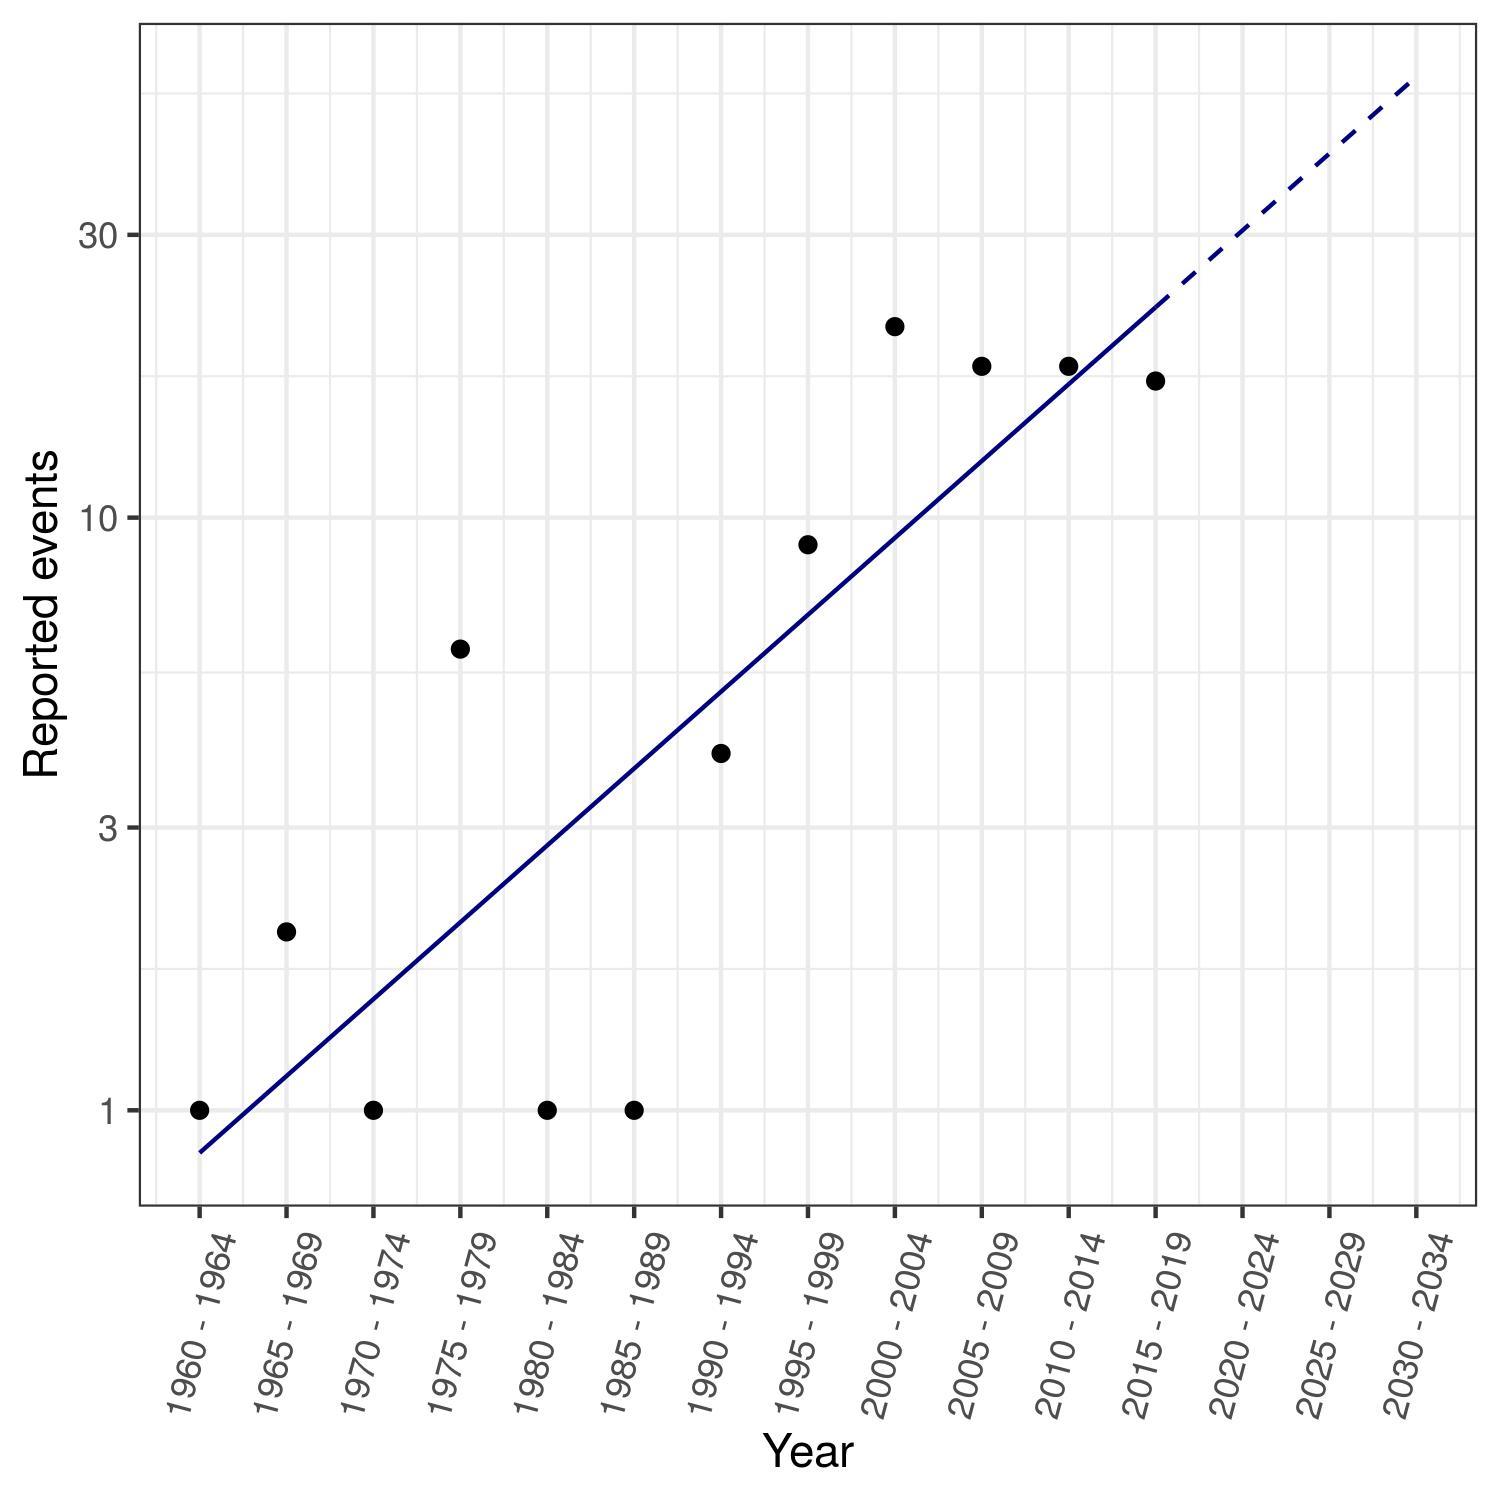
Chart 1 shows the frequency of epidemics caused by wildlife zoonoses. (It fits a log-linear model to the observed data.) There has been a clear exponential increase of such epidemics, which increased in frequency by a factor of about 3 every 20 years.
Chart 2 shows the number of influenza spillover events. (It applies a linear best fit to the data.) There have been around 10 influenza spillover events each year in recent years, compared to hardly any 25 years ago.
| Chart 1: Increasing Frequency of Epidemics caused by Wildlife Zoonoses (excluding Influenza) (log-normal scale) |
 |
| Chart 2: Increasing Frequency of Reported Influenza Spillover Events |
 |
